

October 2026 DVC Field Guide Resale Market Update
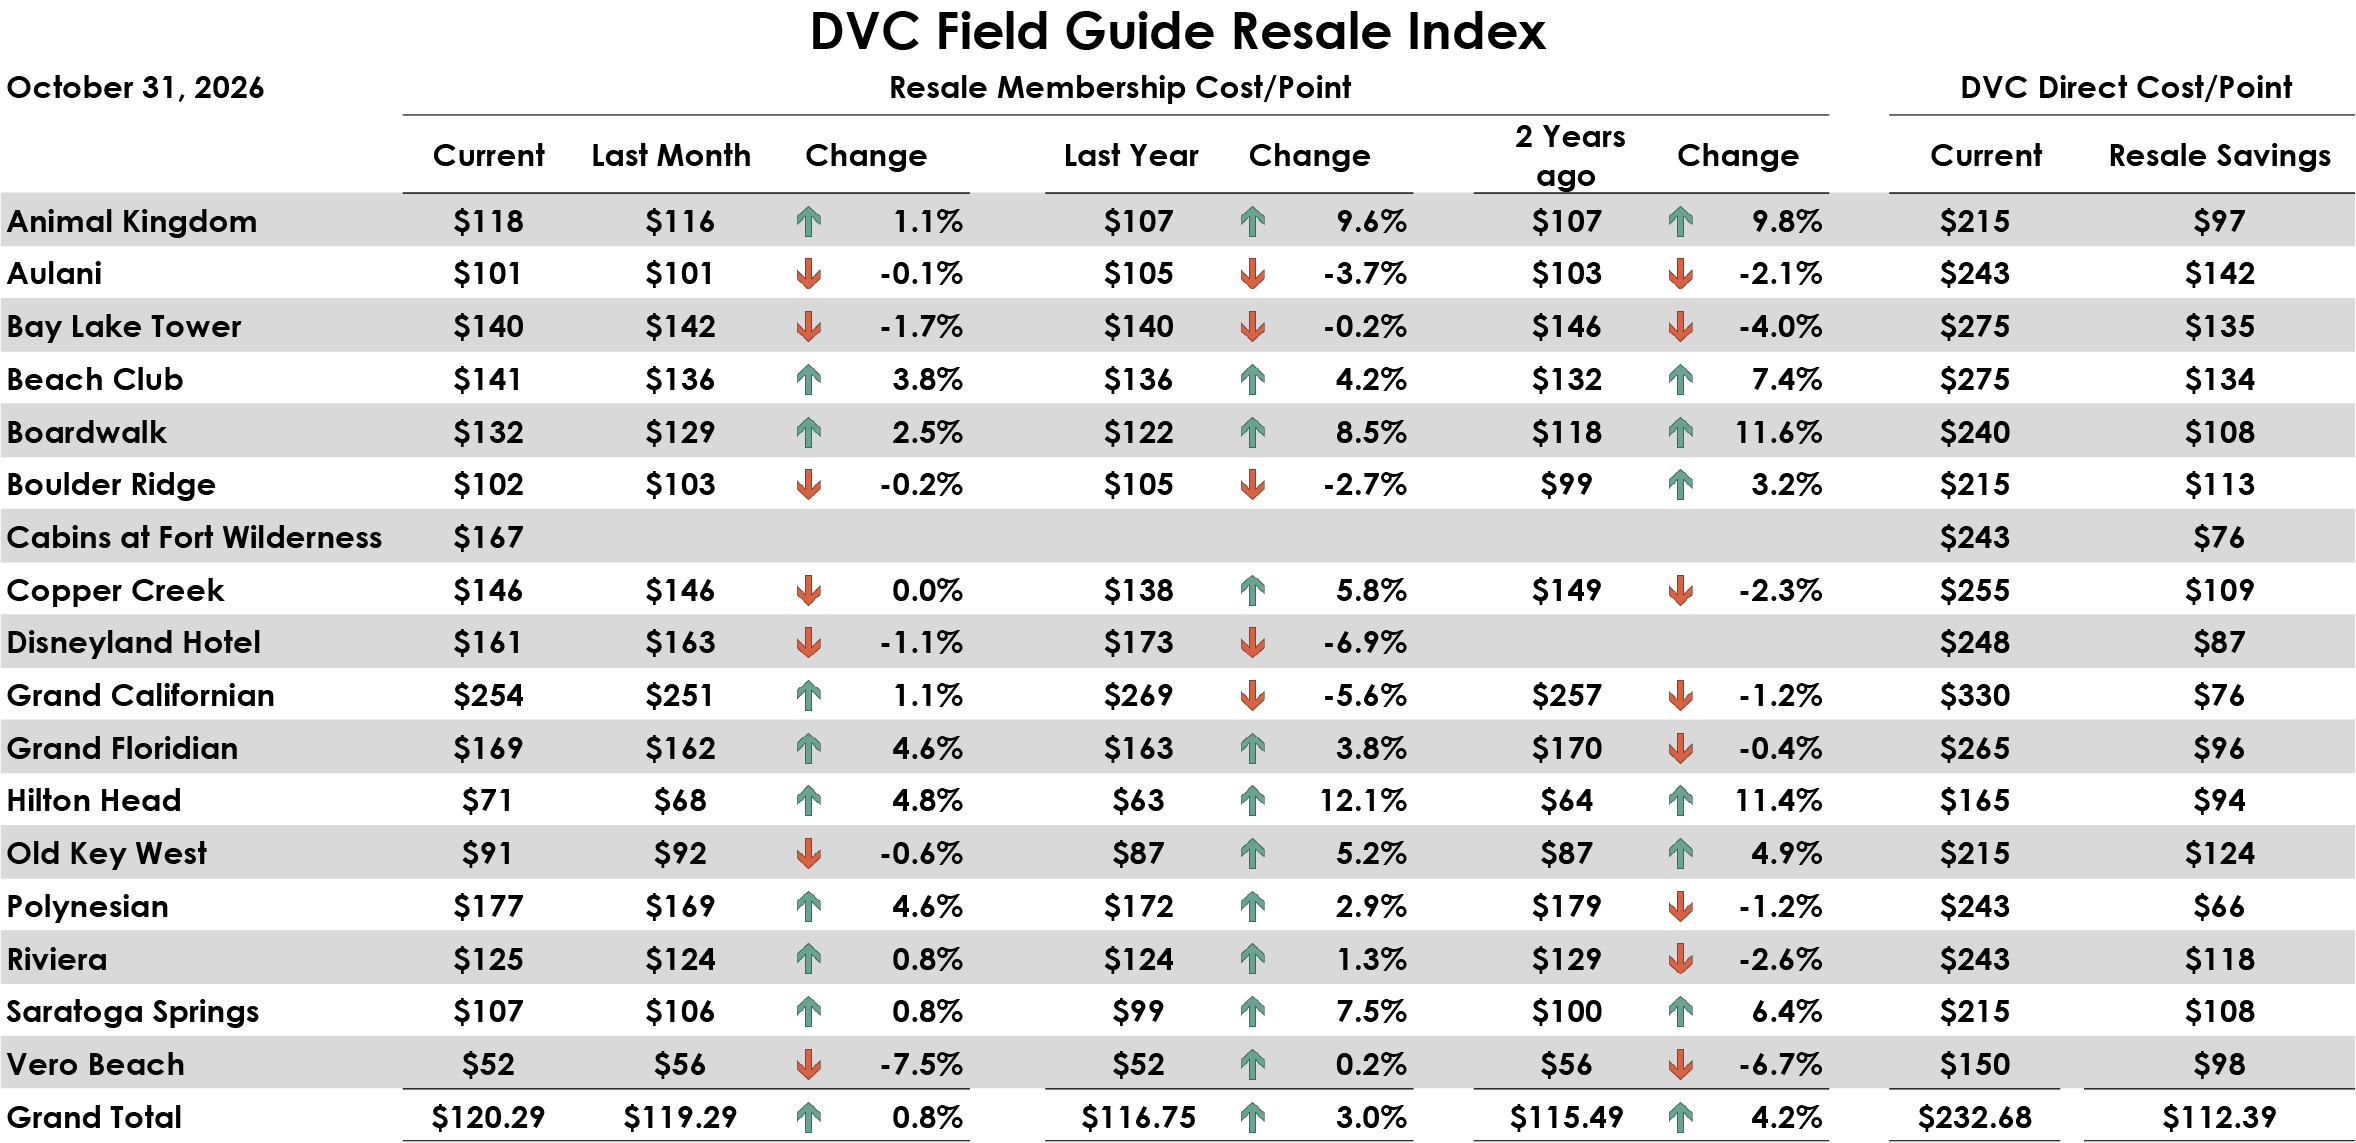
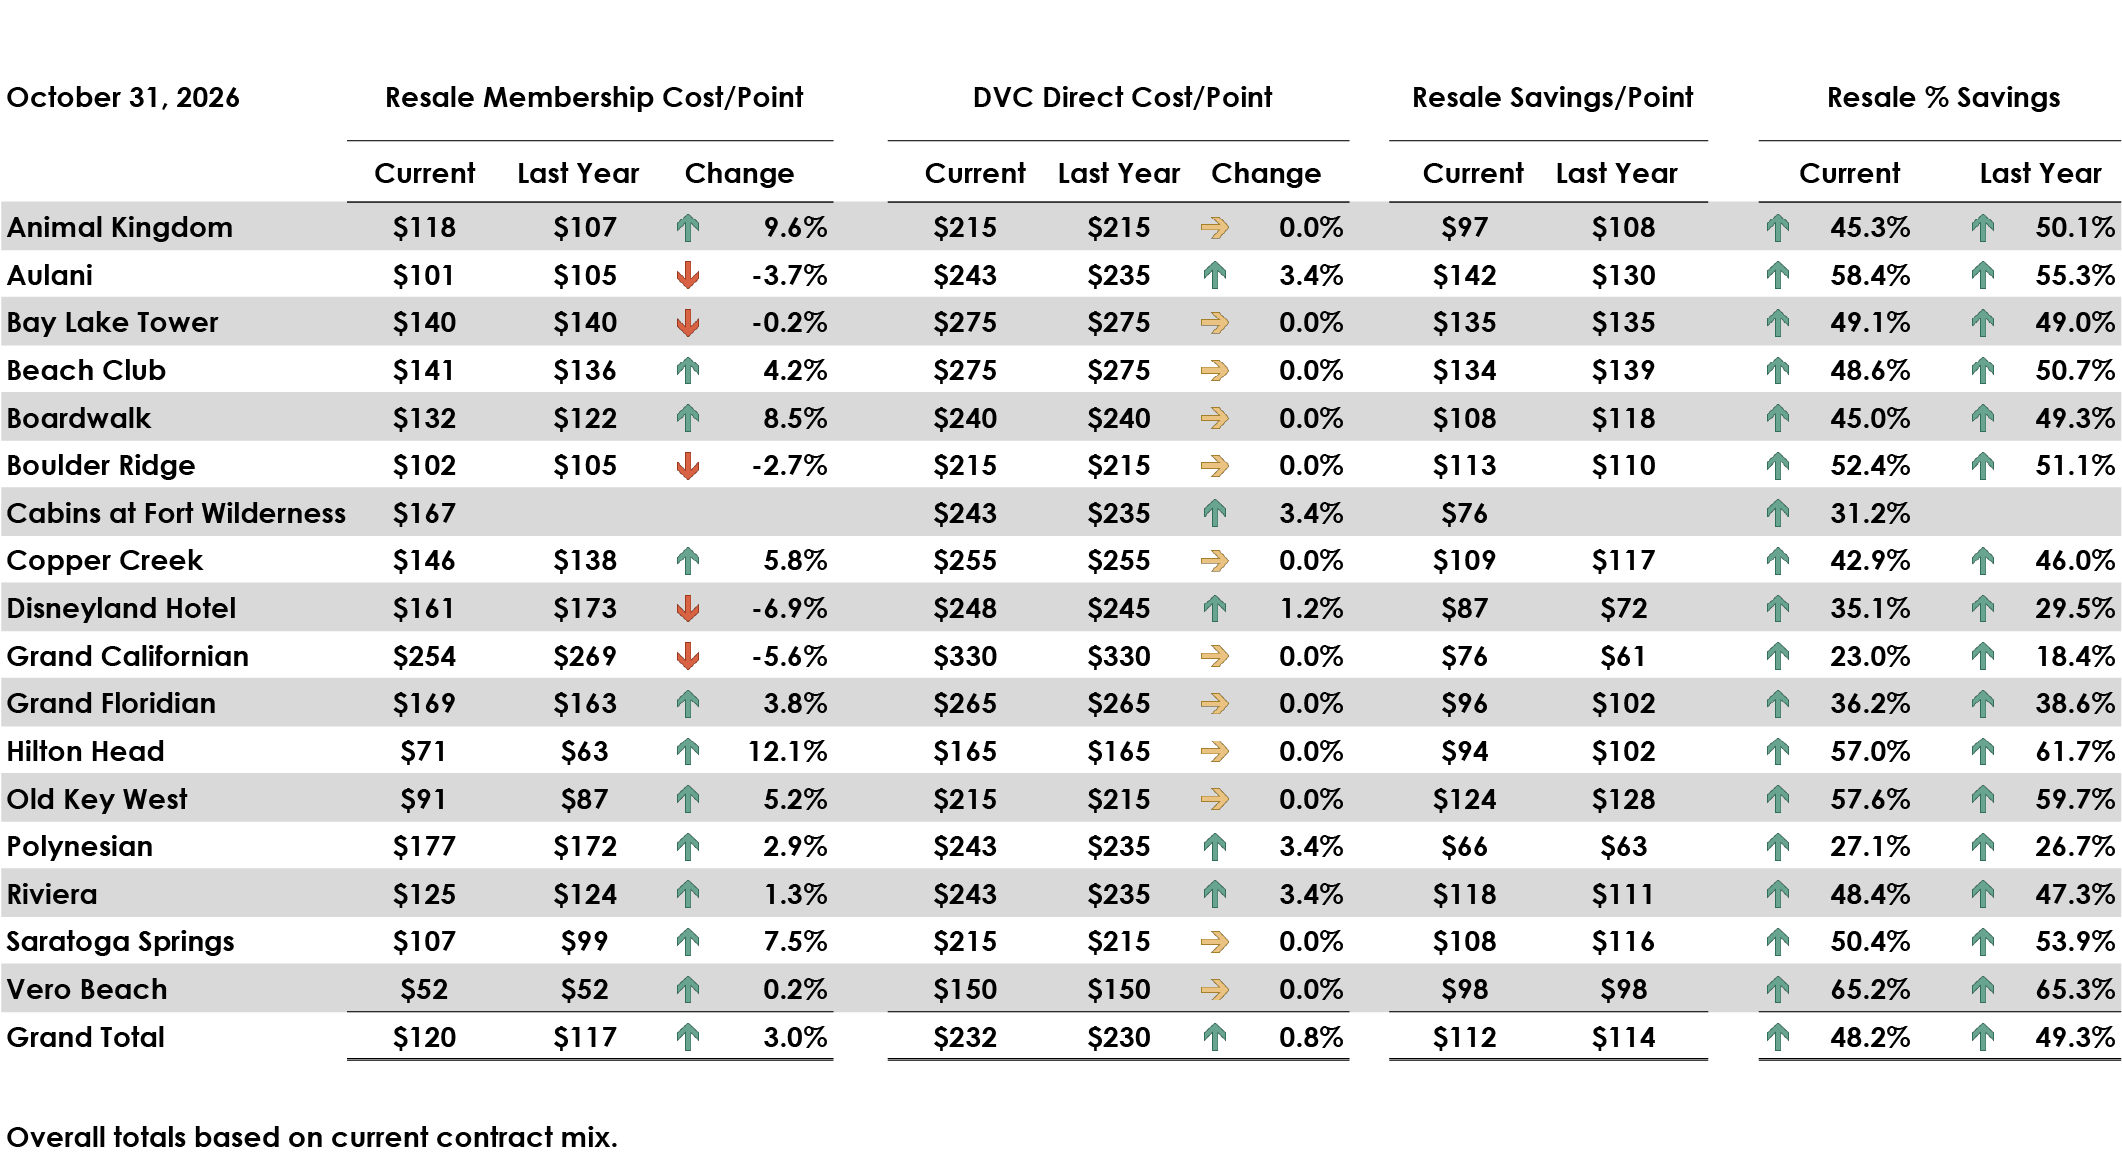
The October 2026 DVC Field Guide Resale Index rose to $120.29 per point, up 0.8% from September. The Index is now 3.0% higher than October 2025 and 4.2% above October 2024, continuing the market’s gradual upward trend during 2026.
The October increase was driven primarily by resorts with contracts extending beyond 2042. The combined average for those resorts rose 1.6% during the month to $131.52 per point. The 2042 resorts increased by a more modest 0.4% to $98.07 per point.
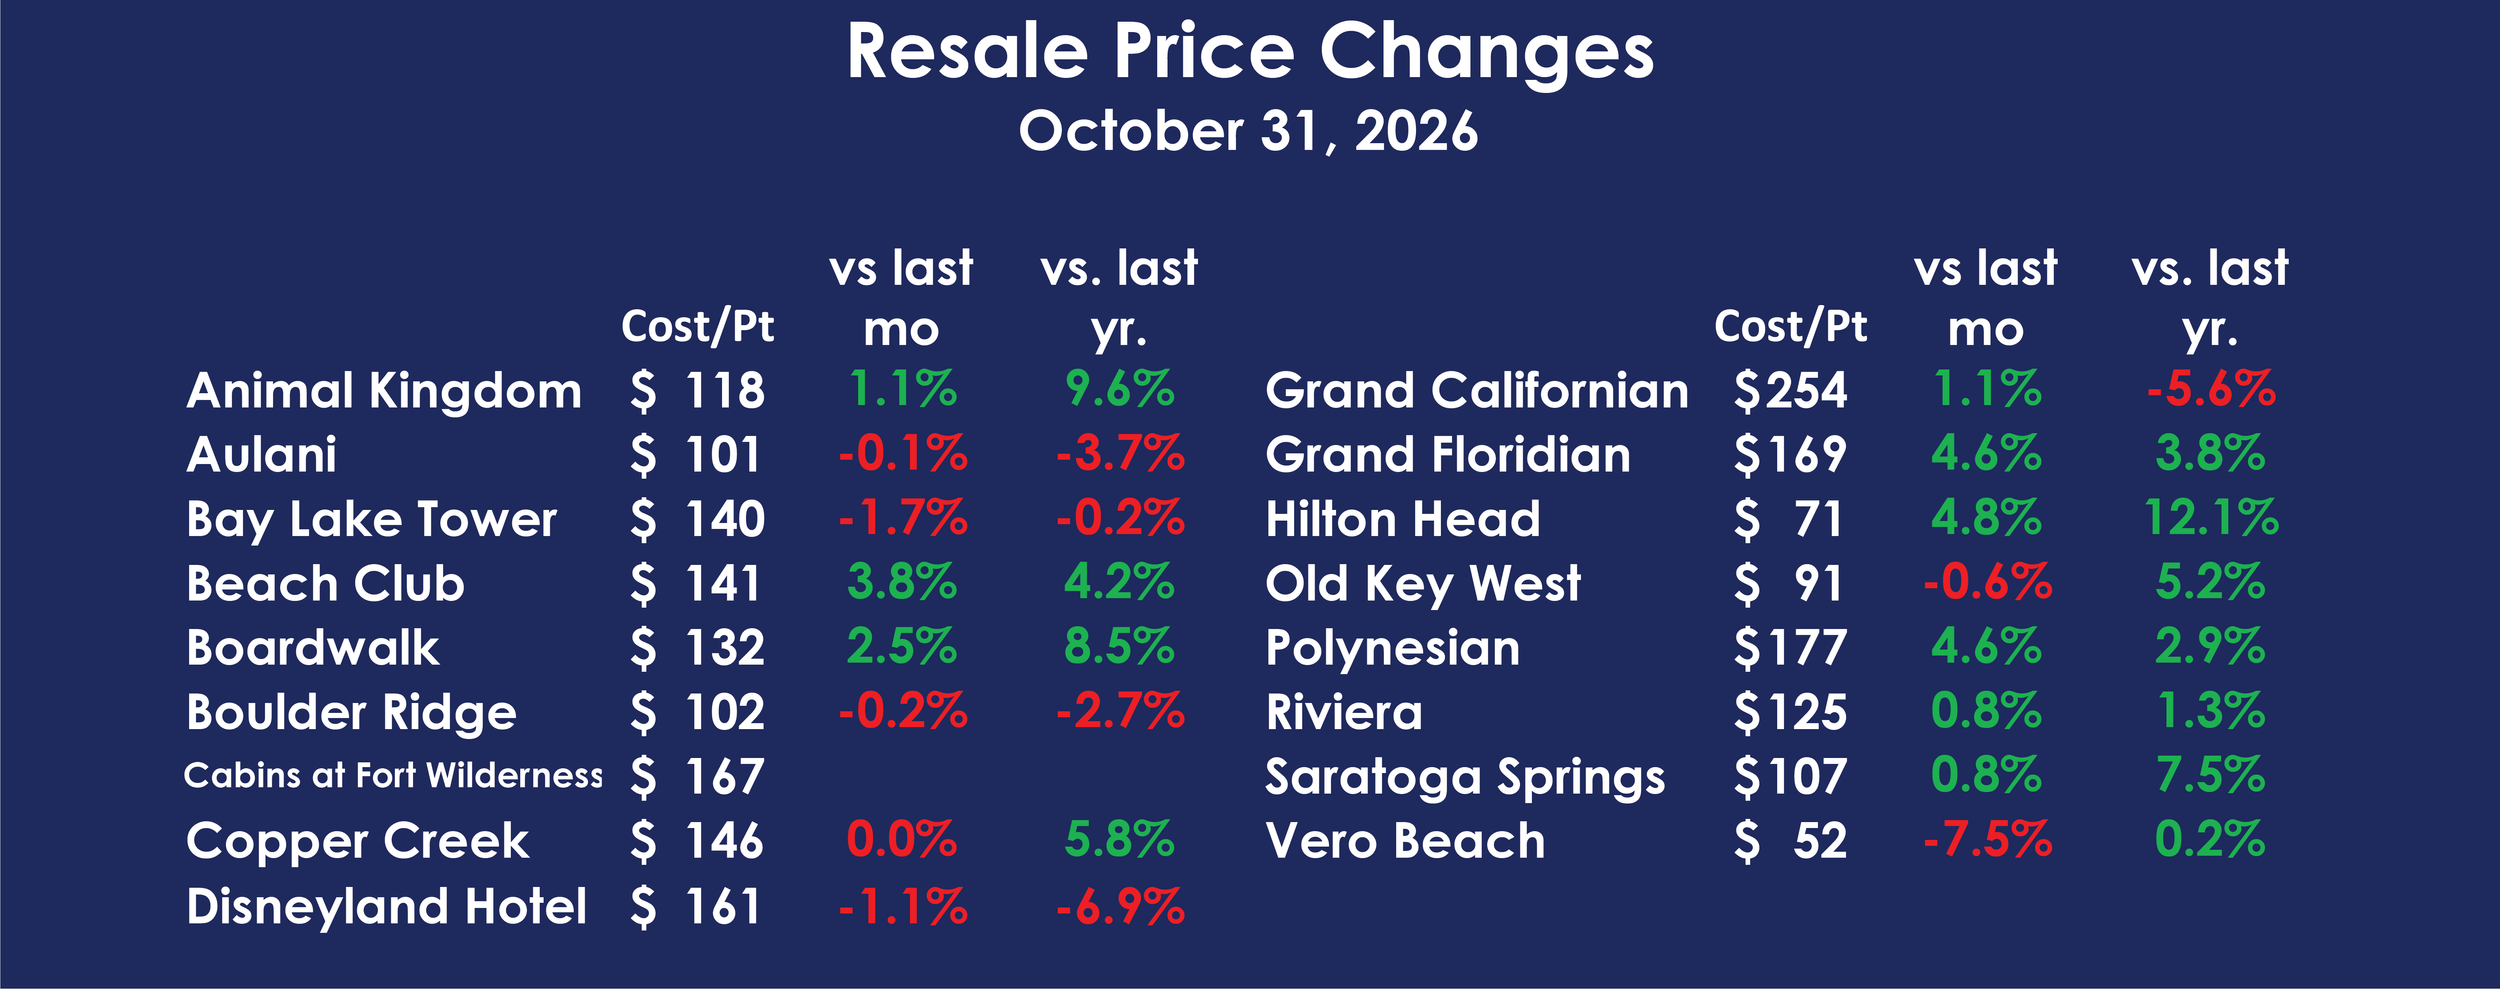
Several resorts contributed to October’s increase. Hilton Head rose 4.8% to approximately $71 per point. Grand Floridian and Polynesian each increased 4.6%, reaching approximately $169 and $177, respectively. Beach Club gained 3.8% to $141, while BoardWalk increased 2.5% to $132.
Animal Kingdom and Grand Californian each rose 1.1% during the month. Riviera and Saratoga Springs increased 0.8%, while Copper Creek remained essentially unchanged at approximately $146 per point.
The largest monthly decline occurred at Vero Beach, which fell 7.5% to approximately $52 per point. Bay Lake Tower declined 1.7% to $140, Disneyland Hotel fell 1.1% to $161, and Old Key West decreased 0.6% to $91. Aulani and Boulder Ridge were nearly unchanged.
Over the past year, the strongest increases occurred at Hilton Head, Animal Kingdom, BoardWalk, and Saratoga Springs. Hilton Head rose 12.1%, Animal Kingdom increased 9.6%, BoardWalk gained 8.5%, and Saratoga Springs increased 7.5%. Copper Creek was up 5.8%, Old Key West rose 5.2%, and Beach Club increased 4.2%.
The largest year-over-year declines were concentrated among the western resorts. Disneyland Hotel fell 6.9%, Grand Californian declined 5.6%, and Aulani decreased 3.7%. Boulder Ridge fell 2.7%, while Bay Lake Tower was essentially unchanged from one year ago.
Resale Inventory Remains Well Below Prior Years
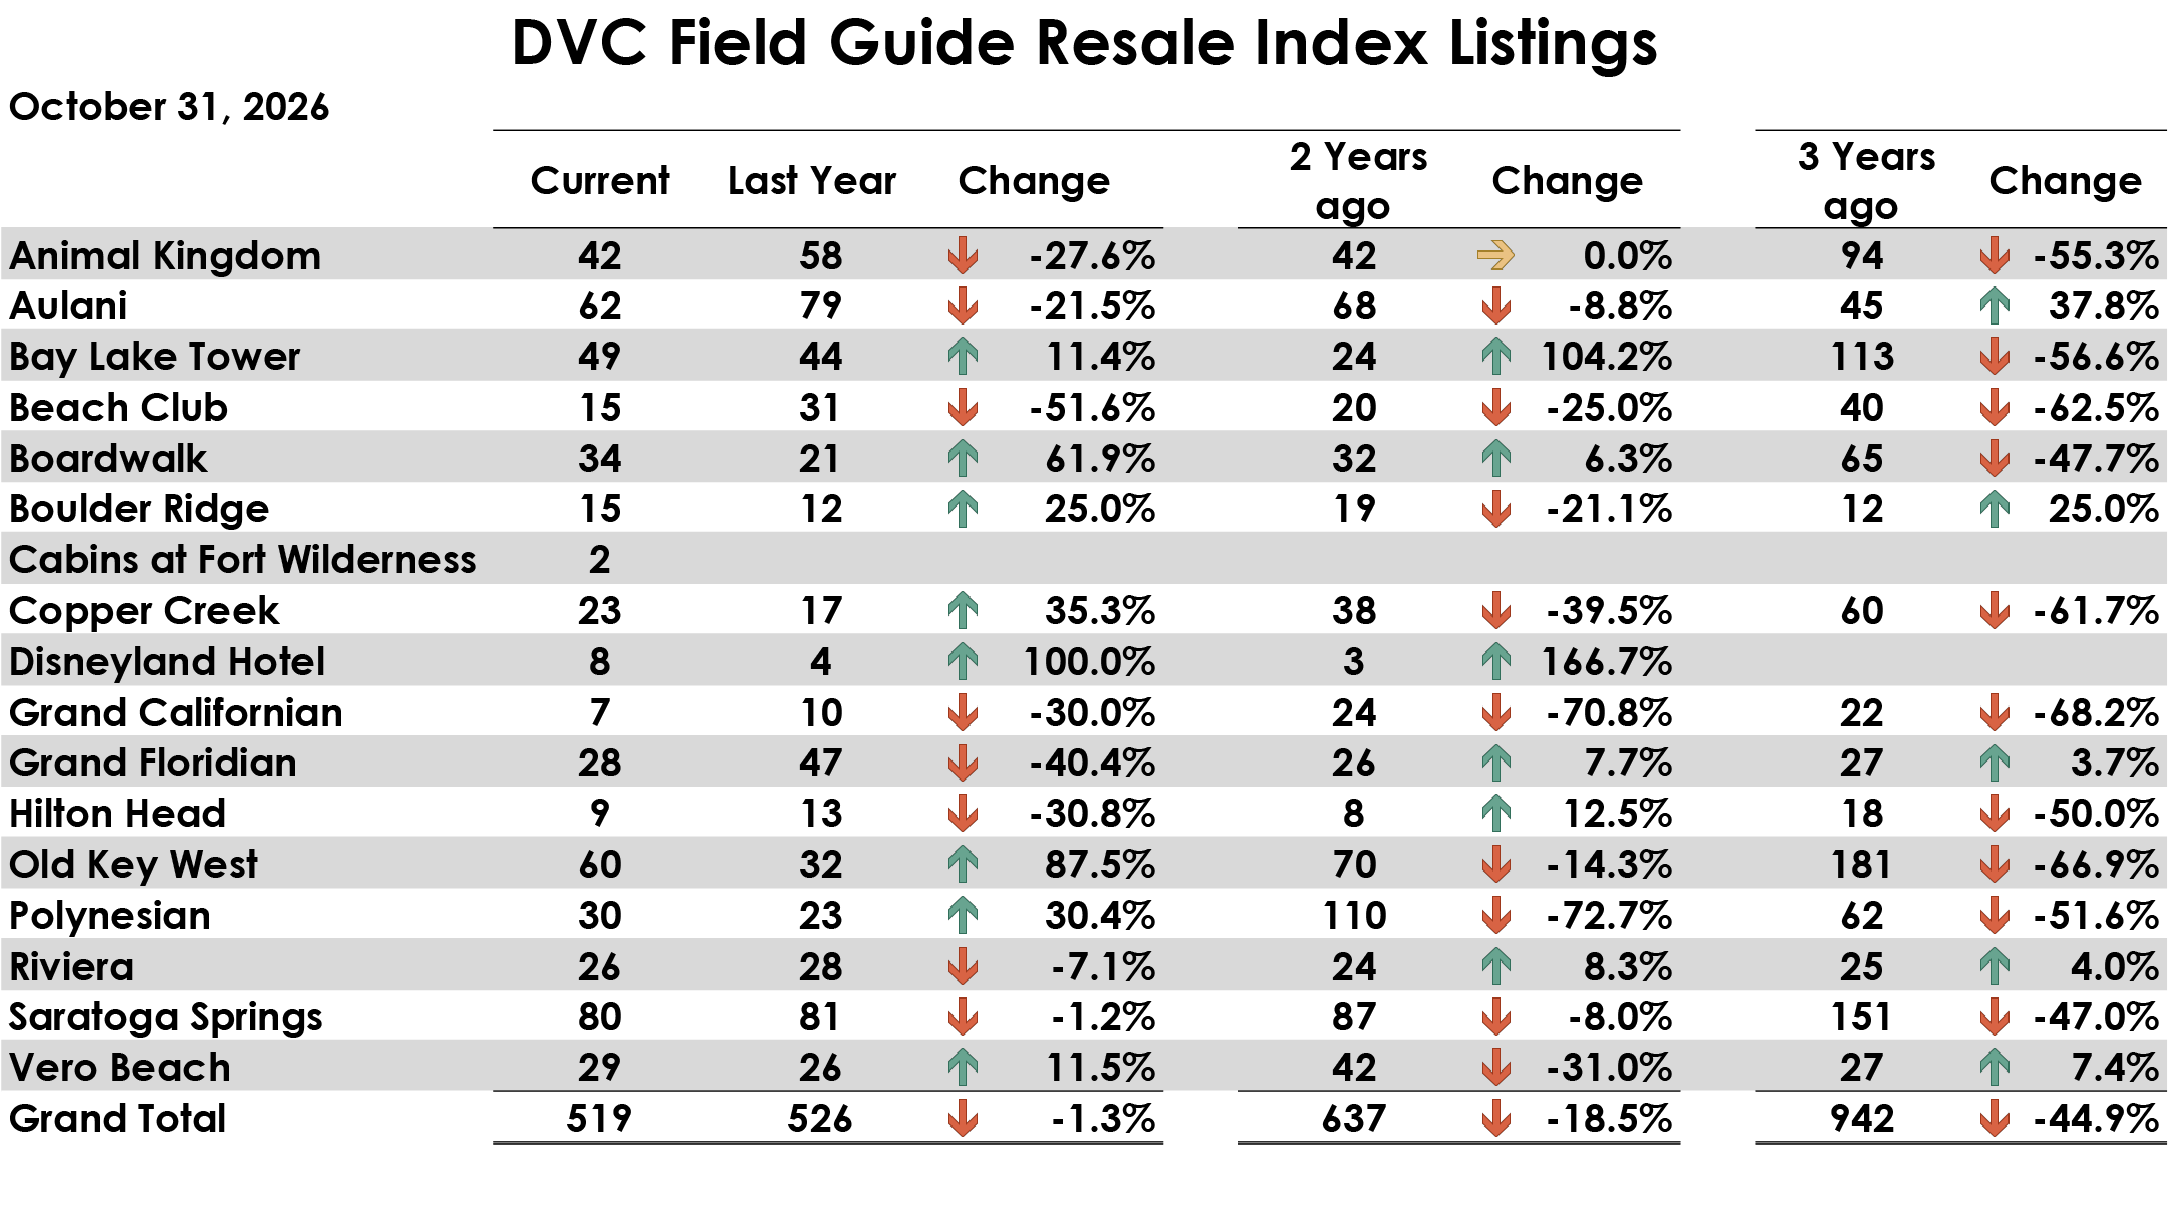
There were 519 resale contracts included in the October inventory count, compared with 526 contracts one year ago. That represents a decline of only 1.3%, indicating that total inventory has stabilized compared with the more substantial reductions recorded during the previous several years.
The longer comparison still shows a much tighter market. October inventory was 18.5% below October 2024 and 44.9% below October 2023, when the same brokers carried 942 contracts.
The available inventory was also concentrated at a relatively small number of resorts. Saratoga Springs accounted for 80 listings, Aulani for 62, Old Key West for 60, Bay Lake Tower for 49, and Animal Kingdom for 42. Together, those five resorts represented approximately 56% of all contracts included in the October count.
Inventory remained particularly limited at several resorts. Only two Cabins at Fort Wilderness contracts, seven Grand Californian contracts, eight Disneyland Hotel contracts, and nine Hilton Head contracts were included. Beach Club and Boulder Ridge each had 15 listings.
Old Key West experienced the largest numerical year-over-year increase, rising from 32 to 60 contracts. BoardWalk inventory increased from 21 to 34, Polynesian rose from 23 to 30, Copper Creek increased from 17 to 23, and Bay Lake Tower rose from 44 to 49.
Those increases were offset by substantial declines elsewhere. Beach Club inventory fell 51.6%, Grand Floridian declined 40.4%, Hilton Head fell 30.8%, Grand Californian declined 30.0%, and Animal Kingdom decreased 27.6%. Aulani inventory was down 21.5%.
The relationship between inventory and pricing was especially noticeable at several resorts. Hilton Head inventory declined 30.8% while its average price increased 12.1%. Animal Kingdom had 27.6% fewer listings while its price rose 9.6%, and Beach Club inventory fell by more than half while its average price increased 4.2%.
BoardWalk and Old Key West produced different results. BoardWalk inventory increased 61.9% from one year ago, yet its average price still rose 8.5%. Old Key West inventory increased 87.5%, but its price remained 5.2% above October 2025. Those results suggest that additional inventory has not necessarily exceeded buyer demand at those resorts.
The total inventory count may now be approaching a more stable level, but buyers still have substantially fewer choices than they did several years ago. The market contains 423 fewer listings than it did in October 2023, and much of the remaining inventory is concentrated at Saratoga Springs, Aulani, and Old Key West.
Resale Savings Compared with Direct Pricing
Based on the current mix of contracts, the average DVC direct price was approximately $232.68 per point, compared with a resale average of $120.29. The resulting average savings was approximately $112.39 per point, meaning resale prices were about 48.2% below direct pricing.
Aulani provided the largest dollar savings at approximately $142 per point. Bay Lake Tower followed with savings of $135 per point, Beach Club $134, Old Key West $124, Riviera $118, and Boulder Ridge $113.
Vero Beach provided the largest percentage discount, with resale pricing approximately 65.2% below direct pricing. Aulani offered savings of 58.4%, Old Key West 57.6%, Hilton Head 57.0%, and Boulder Ridge 52.4%. Saratoga Springs was available at approximately half its direct price.
The smallest percentage discount belonged to Grand Californian. Its $254 resale average was approximately 23.0% below the $330 direct price. Polynesian provided savings of approximately 27.1%, while the Cabins at Fort Wilderness were 31.2% below direct pricing. Disneyland Hotel provided savings of 35.1%, and Grand Floridian was 36.2% below its direct price.
The overall resale discount narrowed slightly from 49.3% in October 2025 to 48.2% in October 2026. Resale prices increased more quickly than direct prices during that period, but resale continued to provide substantial savings at nearly every resort.
Purchase Price and Annual Dues
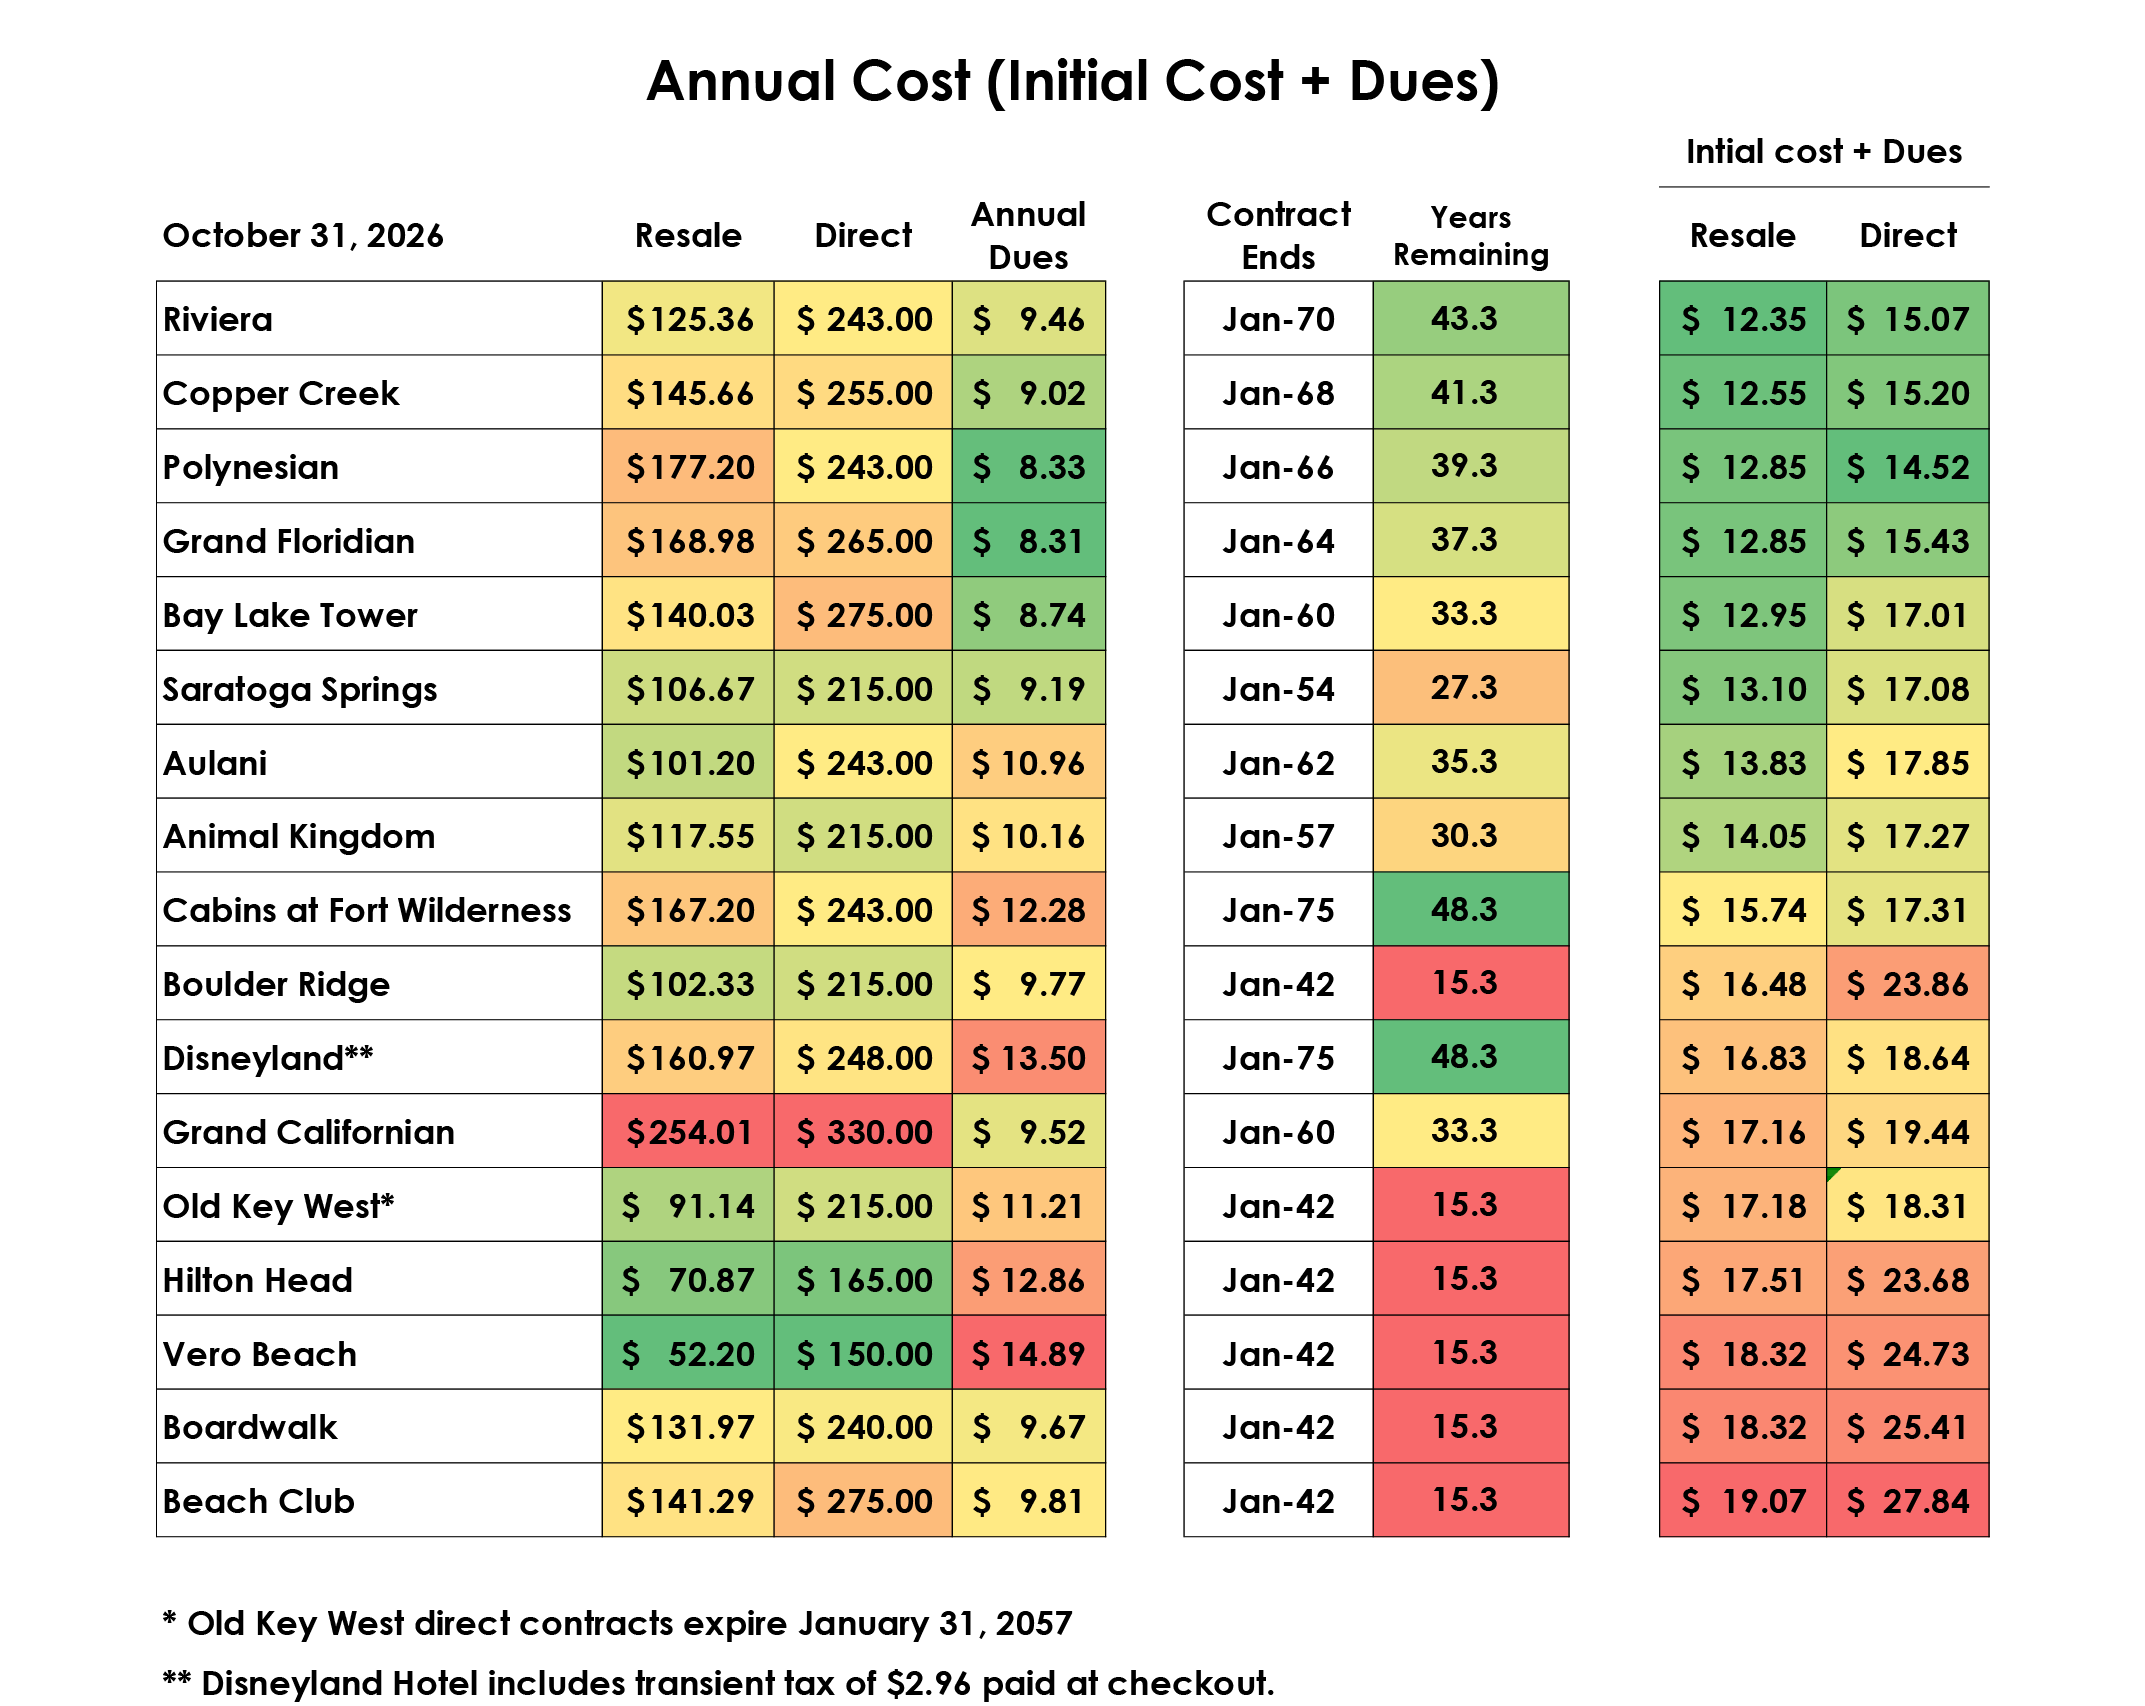
Purchase price alone does not provide a complete picture of long-term ownership cost. The DVC Field Guide annual-cost comparison combines current Annual Dues with the initial purchase price distributed across the remaining years of the contract.
Using this method, Riviera had the lowest estimated annual resale cost at approximately $12.35 per point, followed by Copper Creek at $12.55. Polynesian and Grand Floridian were each approximately $12.85, Bay Lake Tower was $12.95, and Saratoga Springs was $13.10.
These results illustrate the value of a longer contract. Riviera, Copper Creek, Polynesian, and Grand Floridian have higher resale purchase prices than several older resorts, but their remaining contract life allows that initial cost to be distributed across many more years.
Aulani’s estimated annual resale cost was $13.83 per point, while Animal Kingdom was $14.05. The Cabins at Fort Wilderness were approximately $15.74. Although the Cabins have the longest contract in the comparison, their relatively high resale price and Annual Dues of $12.28 offset much of that advantage.
The 2042 resorts generally ranked near the bottom of the annualized resale comparison because their purchase prices must be recovered over approximately 15 remaining years. Beach Club had the highest estimated annual resale cost at $19.07 per point. BoardWalk and Vero Beach were each approximately $18.32, Hilton Head was $17.51, Old Key West was $17.18, and Boulder Ridge was $16.48.
The October data also illustrates the differences within the 2042 group. Beach Club and BoardWalk command substantially higher purchase prices because of their locations and Home Resort booking advantages. Vero Beach has the lowest purchase price, but its Annual Dues of $14.89 per point are the highest among the resorts included in the comparison.
The annual-cost comparison should not be interpreted as identifying one universally superior Home Resort. Booking priority, preferred accommodations, point charts, contract restrictions, expiration dates, Annual Dues, and expected vacation use must also be considered. However, the calculation provides an important reminder that the lowest purchase price does not always produce the lowest long-term ownership cost.
October Market Perspective
October produced another modest increase in the DVC Field Guide Resale Index, but the larger story remains the market’s stability. The Index is now 3.0% higher than it was one year ago, while the number of available contracts is nearly unchanged.
The distribution of that inventory remains important. Buyers have more Old Key West, BoardWalk, Polynesian, and Copper Creek contracts from which to choose, but substantially fewer Beach Club, Grand Floridian, Hilton Head, Animal Kingdom, and Grand Californian listings. The overall total therefore does not fully describe the choices available to someone seeking a particular Home Resort.
The continuing strength of several 2042 resorts is also notable. Beach Club, BoardWalk, and Hilton Head all increased during October despite having only about 15 years remaining. Buyers are clearly not valuing these resorts solely according to their expiration date. Location, booking difficulty, resort preference, Annual Dues, and available inventory continue to create significant differences.
Overall, the October results describe a resale market with stable inventory, modestly rising prices, and substantial savings compared with direct purchasing. The market is no longer experiencing the dramatic inventory reductions seen during the previous several years, but the number of available contracts remains far below earlier levels. As always, buyers should evaluate each resort individually and consider purchase price, Annual Dues, contract length, booking priority, restrictions, and how the Membership will actually be used.
About the DVC Field Guide
The DVC Field Guide is an independent resource for current and prospective Disney Vacation Club members, providing in-depth analysis of resale pricing, historical trends, annual dues, ownership costs, and booking availability. Its monthly market indexes track resale activity from the three largest Disney Vacation Club resale brokers—DVC Resale Market, Fidelity Real Estate, and The Timeshare Store—to provide an objective view of market conditions.